The latest from Bill Conerly (click on each graph below to enlarge):

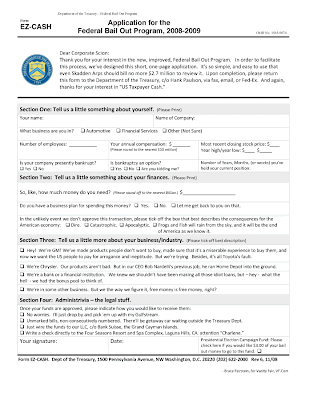
Sorry, couldn't resist
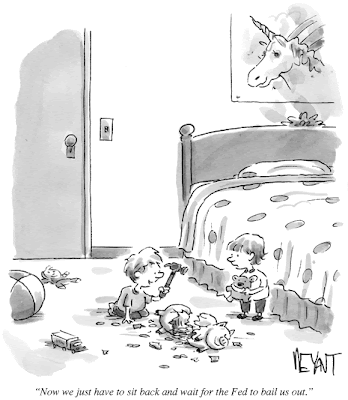
What are we teaching the next generation?
Valuation of the stock market
 This chart, courtesy of Jim Hamilton, shows the stock market relative to the average of the past ten years of earnings. The red line is the historical average. (Click on the graph to enlarge.) According to this metric, stocks are now cheap, but not exceptionally so.
10 Market Rules to Remember
Bob Farrell’s (Merrill Lynch chief market strategist from 1967-1992) 10 Market Rules to Remember (link):
1) Markets tend to return to the mean over time.
2) Excesses in one direction will lead to an opposite excess in the other direction.
3) There are no new eras — excesses are never permanent.
4) Exponential rapidly rising or falling markets usually go further than you think, but they do not correct by going sideways.
5) The public buys the most at the top and the least at the bottom.
6) Fear and greed are stronger than long-term resolve.
7) Markets are strongest when they are broad and weakest when they narrow to a handful of blue chip names.
8) Bear markets have three stages — sharp down — reflexive rebound —a drawn-out fundamental downtrend.
9) When all the experts and forecasts agree – something else is going to happen.
10) Bull markets are more fun than bear markets
Source: Dennis Gartman of “The Gartman Letter”
Free Fallin'
Interestingly, the Dow was off nearly 500 as of yesterday.
No clue as to why . . . maybe the 18% gain since October 10th is as good an explanation as anything else ?
Perhaps John Mayer has some insight.
Also, a re-post of the following: A Look Back at the past 18 Elections – See What Elections Have Meant to the Economy Over the Past 72 Years (click here)
In “Presidential Cycle,” Ned Davis Research notes the S&P; 500 posted its weakest returns in the first year of the four-year election cycle. Since 1900, stocks have gained just 3.4% on average in the post-election year, compared with gains of 4.0% in the midterm year, 11.3% in the pre-election year and 9.5% in an election year.
U.S. stocks tumbled for a second day today after Cisco Systems Inc. forecast the first revenue decline in five years and News Corp. cut its profit outlook, deepening concern the economic slowdown is hurting earnings. Exxon Mobil Corp. slumped 4.9 percent, leading energy companies to the biggest declines in the Standard & Poor’s 500 Index, as oil slid to a 19-month low near $60 a barrel.
Sound financial practices are needed right now!
Three colleagues and I recently conducted a series of risk management workshops that were held across the nation for nursery and greenhouse growers. As a part of these workshops, Dr. Alan Hodges of the University of Florida discussed strategies to mitigate financial risks in the nursery or greenhouse business. I asked Alan to provide a quick summary of his portion of the workshop in this timely podcast.
For more information regarding financial benchmarks, check out these two articles. Click here and here.
.
The credit squeeze for growers
Click here for a brief conversation I had with Greenhouse Grower’s Online Editor Sara Tambascio recently about what role suppliers and distributors play in the credit situation in floriculture and how growers can weather these volatile times.
How will the candidates' tax plans affect Joe the Grower, Joe the Landscaper, and Joe the Retailer?
According to a new analysis by the Tax Policy Center, a joint project of the Urban Institute and the Brookings Institution, Democrat Barack Obama and Republican John McCain are both proposing tax plans that would result in cuts for most American families. Obama’s plan gives the biggest cuts to those who make the least, while McCain would give the largest cuts to the very wealthy. For the approximately 147,000 families that make up the top 0.1 percent of the income scale, the difference between the two plans is stark. While McCain offers a $269,364 tax cut, Obama would raise their taxes, on average, by $701,885 – a difference of nearly $1 million.
 Poor Joe the Plumber has become a political metaphor: something no one ever wants to be. As we all know by now, based on his actual (rather than aspirational) income of $40,000, Joe would get a slightly bigger tax cut under President Obama than President McCain.
But in one sense, even though the real Joe doesn’t own a business, most small business owners, like Joe, also have very modest incomes. Based on a sample of individual income tax returns, TPC finds that among tax units that receive most of their income from their own business, a partnership or a farm (reported on schedules C, E, or F), more than half have income below $30,000 and 80 percent make less than $100,000. (Table T07-0206)
The vast majority of small businesses would not be affected by Obama’s income tax increases. Among those that receive at least half of their income from a business or farm, 335,000 (2.7 percent) are in the top two tax brackets that are targeted for Obama’s tax increases. (Table T08-0164) Among tax units with any income from a business, 663,000 (1.9 percent) are in those tax brackets. Clearly, most business owners are safe from Obama’s individual income tax increases.
The individual income tax return data do not provide a precise picture of how taxes affect “true” small business owners. Some people who report business income on their tax returns are not really self-employed and some small businesses are “C” corporations that pay corporate instead of individual income tax on their business profits.
Many people report some business income from freelance activities while they are full-time employees. Members of corporate boards, for example, report their compensation for that service on schedule C of their individual tax return. Partners in many law firms, accounting firms, medical practices, and Wall Street hedge funds also report business income rather than wages, as do people who receive rents or royalties from investments in real estate and oil and gas partnerships.
All of these factors overstate counts of small business owners based on individual income tax return data. On the other hand, some small businesses are organized as taxable corporations (C corporations) and pay out all or most of their income as compensation to their owners to minimize corporate tax.
Despite these caveats, it seems likely that relatively few taxpayers who are small business owners (including Joe the Grower; Joe the Landscaper; and Joe the Retailer) will be affected by increases in the top two individual income tax rates.
Sources: Washington Post, 10/20/08; Tax Policy Center TaxVox blog, 10/14/08
Comparison of subprime devastation and S&L collapse
Interesting graphic (click to enlarge) from Bloomberg, comparing the present Subprime debacle versus the S&L; crisis. Here is an excerpt:
The $700 billion bailout of Wall Street’s subprime-tainted securities harkens back to the real- estate bets that sparked the savings and loan crisis in the 1980s. The geography’s the same, too.
Then, as now, the government created a taxpayer-funded enterprise to absorb the fallout from bad real-estate investments. A Bloomberg map of the hardest-hit areas shows that, with the exception of Nevada, regions with the highest foreclosure rates also had the most savings-and-loan failures, according to the Federal Deposit Insurance Corp.
The overlap shows that the aggressive lending and speculation that ignited the savings-and-loan meltdown persisted, at least in those areas, according to Paul E. Johnson, who was mayor of Phoenix from 1990 to 1994.
Source:
Subprime Devastation Retraces Path of S&L; Crisis in U.S. States
Jonathan Keehner and Bob Ivry, Bloomberg, Oct. 8 2008


