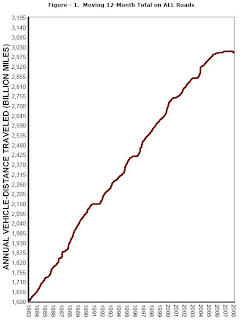
The chart below shows the annual vehicle traffic volume, measured in billions of miles traveled in the U.S., on a moving 12-month basis through February 2008 from the Federal Highway Administration. The flat trend in traffic volume over the last year or more, along with the declines in each of the last four months through February 2008, appears to be the most significant adjustment to traffic volume in any comparable period during the last 25 years. High gas prices appear to be having an effect on driving habits.

Other behavior changes:
More bicycles are being sold.
More folks are taking mass transit.
More small cars are being sold.