 Click here to see a short (02:13 min) video clip regarding the downsizing we’ve seen in recent years in the green industry.
GDP positive in 2nd quarter, but disappoints some
 The GDP report from the BEA raised a lot of concerns about the economic recovery, based on headlines and reports like this:
1. Steep decline in GDP growth raises alarms,
2. US recovery loses steam,
3. Double-dip feared as US economic growth loses pace, and
4. The closer you look at the GDP report, the uglier it gets, etc.
Mark Perry comments: But how does GDP growth in this recovery (assuming the recovery started in third quarter of 2009) over the last four quarters (1.6%, 5%, 3.7% and 2.4%) compare to output growth in the four quarters following the last two recessions in 1990-1991 and 2001? Pretty good actually, see the graph above showing real GDP growth in the one-year periods (four quarters) following the last three recessions.
Sure, real GDP growth has slowed from 5% to 3.7% to 2.4% over the last three quarters, but following the 2001 recession real GDP slowed even more, from 3.5% to 2.1% to 2% to 0.1%. And looking at the average growth over the four quarters following the last three recessions, the average 3.18% real GDP growth over the last year was higher than the 1.93% following the 2001 recession and higher than the 2.63% following the 1990-1991 recession. Keep in mind that the economic recovery that started in 1991 was the longest (120 months) and strongest economic expansion in the history of the U.S.
So what about a headline like “U.S. economic expansion stronger now than at the beginning of the last two recoveries?”
Water issues webinars
Free online presentations to help growers in dealing with water issues
A new series of online water quality and recycling webinars begins August 18 to help growers successfully manage water quality issues and recycle irrigation water.
This education program to promote water conservation is co-sponsored by the Water Education Alliance for Horticulture (a collaborative program hosted by the University of Florida with industry partners), OFA – an Association of Horticulture Professionals, the Society of American Florists, and the Florida Nursery Growers and Landscape Association. The series of 30-minute live presentations will feature both new research and practical guidelines. Registration is free at www.watereducationalliance.org (click on “workshops”) for this series of online presentations. Space is limited, so sign up early.
Beware of Scorched-Earth Strategies in Climate Debates
Dr. Rob Stavins, Director of Harvard’s Environmental Economics program and opening Seeley Conference keynote speaker, has posted an overview of the recent happenings in Washington pertaining to the apparent collapse last week of U.S. Senate consideration of a meaningful climate policy. Click here to read his HRR comments (HRR = highly recommended reading).
How Texas Avoided the Real Estate Bubble: Market-Oriented Land Use Policies
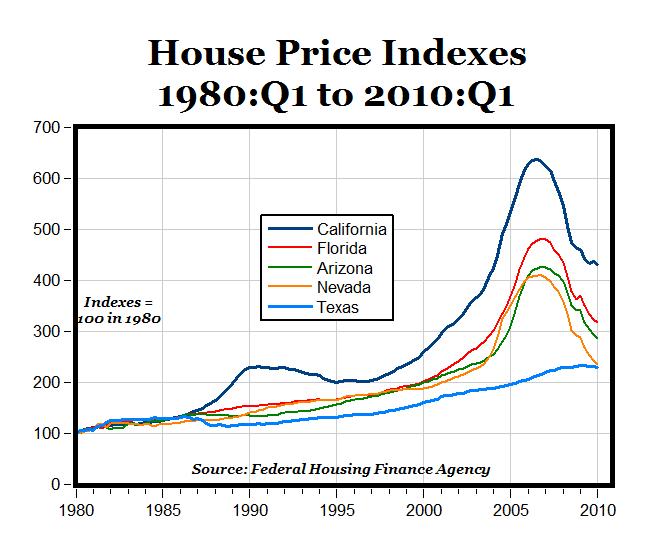
Interesting post by Mark Perry today (including graph below) regarding the article How Texas Avoided the Great Recession:
“One reason that Texas did so well is that it fully escaped the “housing bubble” that did so much damage in California, Florida, Arizona, Nevada and other states (see chart above). One key factor was the state’s liberal, market oriented land use policies. This served to help keep the price of land low while profligate lending increased demand. More importantly, still sufficient new housing was built, and affordably. By contrast, places with highly restrictive land use policies (California, Florida and other places, saw prices rise to unprecedented heights), making it impossible for builders to supply sufficient new housing at affordable prices.
Speculation is often blamed as having contributed to the higher house prices that developed in California and Florida. This is correct. Moreover, with some of the strongest demand in the United States, Texas would seem to have been a candidate for rampant speculation. After all, it happened back in the 1970s when a huge oversupply of housing, industrial, retail and office space collapsed in the face of falling energy prices.
Yet the speculators were not drawn to the metropolitan areas of Texas. This is because speculators or “flippers” are not drawn by plenty, but by perceived scarcity. In housing, a sure road to scarcity is to limit the supply of buildable land by outlawing development on much that might otherwise be available.
However, the speculators did not miss California and Florida. Nor did they miss Las Vegas or Phoenix, where the price of land for new housing rose between five and 10 times as the housing bubble developed. Despite their near limitless expanse of land, much of it was off limits to building, and the exorbitant price increases were thus to be expected.”
MP: The graph below shows that Texas never had a real estate bubble like those in California, Florida, Arizona or Texas. Consequently, Texas never had the real estate crash like in the other states. This article presents an interesting perspective about how restrictive land use policies contributed to the real estate bubbles around the country, and how Texas escaped the Great Recession due to more liberal land use policies.
Role of Immigrants in U.S. Labor Market
People born in other countries are a growing presence in the U.S. labor force. In 2009, more than 1 in 7 people in the U.S. labor force were born elsewhere; 15 years earlier, only 1 in 10 was foreign born. About 40 percent of the foreign-born labor force in 2009 was from Mexico and Central America, and more than 25 percent was from Asia.
Today CBO released an update to its November 2005 report on the role of immigrants in the U.S. labor market. That earlier report included data through 2004; this update, the first of several on various aspects of immigration, incorporates data through 2009 from the Census Bureau’s Current Population Surveys. The update includes various tables showing statistics on the number of foreign-born workers, the countries from which they have come, their educational attainment, the types of jobs they hold, and their earnings.
Some highlights include:
- People born in other countries represent a substantial and growing segment of the U.S. labor force—that is, people with a job or looking for one. In 2009, 24 million members of the labor force were foreign born, up from 21 million in 2004. However, the growth of the foreign-born labor force was much slower between 2004 and 2009 than between 1994 and 2004.
- In 2009, over half of the foreign-born workers from Mexico and Central America did not have a high school diploma or GED credential, as compared with just 6 percent of native-born workers. Yet nearly half of the foreign-born workers from places other than Mexico and Central America had at least a bachelor’s degree, as compared with 35 percent of native-born workers.
- Over time, participants in the U.S. labor force from Mexico and Central America have become more educated. In 2009, they had completed an average of 9.8 years of schooling—up from 9.5 years in 2004; 55 percent lacked a high school diploma or GED credential—down from 59 percent in 2004; and among 16- to 24-year-olds, 50 percent were not in school and were not high school graduates—down from 60 percent in 2004. Nevertheless, those born in Mexico and Central America constitute an increasingly large share of the least educated portions of the labor force.
- To a considerable extent, educational attainment determines the role of foreign-born workers in the labor market. In 2009, 70 percent of workers born in Mexico and Central America were employed in occupations that have minimal educational requirements, such as construction laborer and dishwasher; only 23 percent of native-born workers held such jobs.
- Foreign-born workers who came to the United States from places other than Mexico and Central America were employed in a much broader range of occupations. Nevertheless, they were more than twice as likely as native-born workers to be in fields such as computer and mathematical sciences, which generally require at least a college education. Their average weekly earnings were similar to those of native-born men and women.
- On average, the weekly earnings of men from Mexico and Central America who worked full time were just over half those of native-born men; women from Mexico and Central America earned about three-fifths of the average weekly earnings of native-born women.
This report was prepared by Nabeel Alsalam of CBO’s Health and Human Resources Division.
Economy still mixed
It could’ve shaped up to be a good week. After all, the Senate pushed through a vote on bank reform, bellwether earnings weren’t all that bad, BP finally seems to have halted the spewing oil in the Gulf, the Northeast got a small reprieve from the heat wave — and last but not least — Apple announced plans to rectify “Antennagate.” Nevertheless, U.S. stocks ended the week on a sour note, as the Dow Jones Industrial Average plunged more than 250 points Friday.
Bank reform moves ahead. This week, the Senate approved the most historic shakeup of the regulation of U.S. banks since the Great Depression. The legislation would place new fees and restrictions on the nation’s biggest banks, impose new restrictions on the Federal Reserve and craft a major new consumer-protection division for mortgage and credit-card products. Read more about the bank-reform legislation .
Just-in-case stimulus. Federal Reserve officials agreed it would be a good idea to study what to do if the economy were to worsen severely, according to a summary of June’s closed-door meeting released this week. Officials said the outlook for the recovery had softened between April and June, but changes to their forecast were “relatively modest” and “not warranting policy accommodation beyond that already in place.” Read more about the Fed minutes .
BP cap seems to be holding. BP shares (BP) slipped Friday as euphoria over the company’s apparent success in stopping the flow of crude from its ruptured well gave way to the realities surrounding the worst oil spill in U.S. history. In its latest update, BP said the well cap continues to hold. But the ruptured well isn’t dead yet, prompting a cautious tone from President Obama in his remarks on the spill. Read more about BP’s efforts to contain the leak .
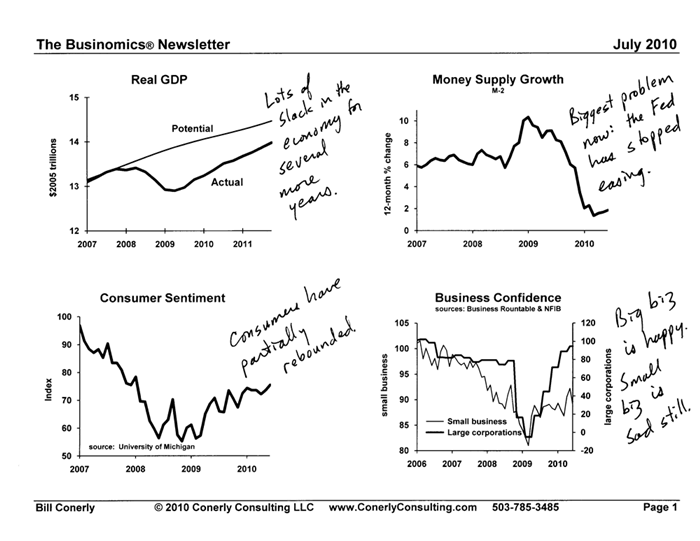
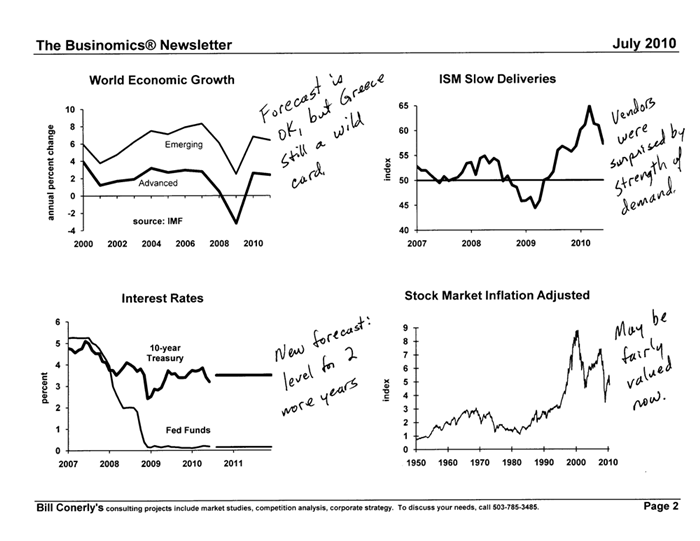
Also, the latest from Bill Conerly.


The Java Index?
As economists look for clues on the direction of consumer spending, they may want to look into how much Americans are willing to spend on their coffee.

Consumers have been more willing to spend since the lows of the recession, but recent declines in retail sales and confidence have sparked worries over whether spending can continue to grow in the second half of the year.
Enter the coffee indicator. A “tell-tale sign of how consumers feel about employment, income and the future is where they buy their coffee and whether they step up for the more expensive concoction,” wrote Majestic Research economist Steve Blitz in a recent research note.
Majestic Research tracks anonymous credit-card data, and can see how much consumers spend by category and store. Blitz broke out the average dollar transactions at Starbucks and Dunkin’ Donuts. The data show that during the worst of the recession consumers spent less at the two coffee outlets, but as the employment picture started to improve people were willing to spend more per transaction.

The trend reversed at the beginning of April when transaction size turned down. To be sure, much of that change is likely seasonal. Transaction size at Starbucks, especially, takes a big spike around the holidays as shoppers buy coffee baskets and mugs for those caffeine addicts on their lists. In the last two years, it has bounced back a bit through the late winter, turning down in April and then moving back up in the late summer/early fall.
So far, this year’s transactions at Starbucks and Dunkin’ Donuts is following the pattern. If that bounce back materializes in the late summer, it could indicate that consumers are still willing to open their wallets. But if the average transaction size levels off or continues to decline, it could indicate a more thrifty consumer will dominate the second half of this year.
Source: Phil Izzo, WSJ Blog, Real Time Economics
Economic news for the week
New and Existing Home Sales Drop in May, After Expiration of Homebuyers’ Tax Credit.
New home sales fell to a record low in May, with sales of new single-family houses dropping 32.7 percent from April to a seasonally adjusted annual rate of 300,000, the lowest annual rate of sales since the Commerce Department started tracking the data in 1963 (read more here; see chart).
Excluding Transportation, Durable Goods Orders Rise.
Durable goods orders, excluding transportation, rose by 0.9 percent in May to $145.1 billion, the U.S. Census Bureau reported. Year-over-year, durable goods, excluding transportation, increased 17.6 percent. Transportation orders fell 6.9 percent to $46.9 billion, driven by a $3.0 billion decline (29.6 percent) in nondefense aircraft and parts (read more here).
First Quarter GDP Growth Revised Downward.
The economy grew more slowly in the first quarter of 2010 than previously estimated, according to the final real GDP estimate from the Bureau of Economic Analysis. GDP growth was revised to 2.7 percent, down from the second estimate of 3.0 percent, primarily reflecting a downward revision in personal consumption expenditures and net exports (read more here).
Personal Income Increases
Personal income in May 2010 increased 0.4% from April 2010.Real personal consumption expenditures (PCE) increased 0.3% and real disposable personal income (DPI) rose 0.5%.The personal savings rate as a percentage of DPI was 4.0% in May.
Consumer Confidence Rises
Consumer sentiment rose in June to its highest since January 2008 while reports of job losses were down sharply from a year ago, a survey showed on Friday. A gauge of current economic conditions also rose to its highest since January 2008, according to the Thomson Reuters/University of Michigan’s Surveys of Consumers. NEW YORK (Reuters)
America in Bloom receives award
America in Bloom has been named to the 2010 Associations Advance America Honor Roll, a national awards program sponsored by the American Society of Association Executives & The Center for Association Leadership in Washington, D.C.
The prestigious awards program recognizes associations that propel America forward – with innovative projects in education, skills training, standards setting, business and social innovation, knowledge creation, citizenship, and community service. Although association activities have a powerful impact on everyday life, they often go unnoticed by the general public.
“America in Bloom’s program truly embodies the spirit of the Associations Advance America campaign. It is an honor and an inspiration to showcase this activity as an example of the many contributions associations are making to advance American society,” remarked Associations Advance America Committee Chair Ping Wei.
If folks in the industry would like to support AIB financially, now is the time to do it. Between now and the OFA Shortcourse, AIB is conducting one of their main fundraising events of the year — the AIB Raffle. Proceeds from the raffle and other fundraising events help America in Bloom fund numerous projects for communities and their citizens such as—webinars on plant varieties that perform well in the landscape, an annual educational symposium, and community awards.
Wouldn’t it feel good to put $5,000; $1,000, or even $500 in your pocket? If you purchase an AIB raffle ticket you just might be one of the lucky cash prize winners! The 2009 raffle generated over $30,000 in funding for America in Bloom. Buy your raffle tickets online using their secure form today!

