• Skip to primary navigation
  • Skip to main content
  • Skip to primary sidebar
  • Texas A&M Forest Service
  • Texas A&M Veterinary Medical Diagnostics Laboratory
  • Texas A&M AgriLife Extension Service
  • Texas A&M AgriLife Research
  • Texas A&M College of Agrculture and Life Sciences
Ellison Chair in International Floriculture
Ellison Chair in International FloricultureTeaching, Research, Extension and Service
  • Menu
  • #1593 (no title)
  • Benefits of Plants and Greenscapes
  • Plants, Nature, and Health Initiative
  • Marketing & Economics
  • Water Resources
  • Sustainability
  • Executive Academy for Growth & Leadership (EAGL)

New Estimates of the Housing Wealth Effect

May 1, 2012 by Charlie

A new report from the NBER by Charles W. Calomiris, Stanley D. Longhofer, and William Miles shows that “on average, a single dollar increase in housing wealth raises consumption by between five and eight cents.”

If the value of a homeowner’s house rises by one dollar, how much will that homeowner increase spending on consumption? In The Housing Wealth Effect: The Crucial Roles of Demographics, Wealth Distribution, and Wealth Shares (NBER Working Paper No. 17740), authors Charles Calomiris, Stanley Longhofer, and William Miles determine that the impact of housing wealth on consumer spending depends crucially on the age and wealth distribution within states, as well as on the share of housing wealth relative to total wealth. In particular, they find that young people, who are more likely to be credit-constrained, and older homeowners, who are likely to be “trading down” on their housing stock, experience the largest housing wealth effects. Housing wealth effects also are higher in years when housing wealth shares represent a larger portion of overall wealth an d in years with higher poverty rates. Thus, there tends to be huge variation over time and across states in the size of housing wealth effects.

For this study, the researchers constructed a new annual dataset for each of the U.S. states for the period 1981-2009, taking into account the relative amount of state-level housing and securities wealth in any given year. They also considered differences in age distribution and poverty rates, both across states and over time, because housing wealth effects tend to be larger in state-years with high proportions of young and old people, and in state-years with higher poverty rates. In addition, they estimated holdings of corporate stock in each state by calculating aggregate U.S. stock wealth and multiplying by each state’s share of aggregate mutual fund holdings.

Calomiris, Longhofer, and Miles find that consumption responds positively to innovations in both housing wealth and securities wealth, but that housing wealth effects are significantly larger than stock wealth effects. They estimate that on average, a single dollar increase in housing wealth raises consumption by between five and eight cents. In contrast, the same dollar increase in the value of securities wealth raises consumption by less than two cents. Nonetheless, there is substantial variation across states and over time in both of these consumption responses to wealth changes, which are related to the age, poverty, and wealth characteristics of various states at particular points in time.
Filed Under: Uncategorized Tagged With: housing industry, recovery

Fight of the Century: Keynes vs. Hayek Round Two

February 6, 2012 by Charlie

An entertaining parody of the mindset of many of today’s economists. Also a great illustration of network externalities.

Filed Under: Content Tagged With: economic forecasts, recession, recovery, stimulus

Outlook: Manufacturing Strength Despite Slow Economy

June 21, 2011 by Charlie

A host of factors, ranging from the tsunami in Japan to higher oil prices, have conspired to weaken the outlook for the overall U.S. economy, yet the manufacturing sector continues to forge ahead, according to the Manufacturers Alliance/MAPI U.S. Industrial Outlook, a quarterly report that analyzes 27 major industries.

“The positive momentum of a 2 percent reduction in payroll taxes this year and 100 percent expensing of equipment and software investments has been more than offset by higher oil prices, and Japanese automakers in the U.S. faced a parts shortage as a result of the tsunami,” said Daniel J. Meckstroth, Ph.D., chief economist for the Manufacturers Alliance/MAPI and author of the analysis. “Manufacturing, though, is currently well positioned for growth. There is pent-up demand for consumer durables, firms are profitable and need to spend more for both traditional and high-tech business equipment, and strong growth in emerging economies is driving U.S. exports.”

By supplying major assumptions for the economy and running simulations through the IHS Global Insight Macroeconomic Model, the Alliance generates unique macroeconomic and industry forecasts.

Manufacturing industrial production, measured on a quarter-to-quarter basis, grew at a 7 percent annual rate in the first quarter of 2011, after expanding at a 3.4 percent annual rate in the fourth quarter of 2010. MAPI forecasts that manufacturing production will increase 6 percent in 2011 and advance by 4 percent in 2012.

Production in non-high-tech manufacturing expanded at a 5.7 percent annual rate during the first quarter of 2011. According to the MAPI report, non-high-tech manufacturing production (which accounts for 90 percent of the total) is expected to increase 5 percent in 2011 and 4 percent in 2012. High-tech industrial production rose at a 21 percent annual rate in the first quarter of 2011. MAPI anticipates this sector will post strong 15 percent growth in 2011 and 13 percent growth in 2012.

As shown in the new report, 18 of the 27 industries MAPI monitors had inflation-adjusted new orders or production above the level of one year ago, two more than reported in the previous quarter, and four industries remained flat. Industrial machinery grew by 32 percent in the three months ending April 2011 compared to the same period one year earlier, while mining and oil and gas field machinery production improved by 29 percent in the same time frame.

The largest drop came in housing starts, which declined 15 percent. Private nonresidential construction experienced an 11 percent decline.

Meckstroth reports that five industries are in the accelerating growth (recovery) phase of the business cycle; 17 industries are in the decelerating growth (expansion) phase; two industries appear to be in the accelerating decline (either early recession or mid-recession) phase; and three are in the decelerating decline (late recession or very mild recession) phase of the cycle.

The report also offers economic forecasts for 24 of the 27 industries. MAPI forecasts that 21 of the 24 industries will show gains in 2011, led by mining and oil and gas field machinery, and industrial machinery, each with expected 26 percent growth. One industry, electric lighting equipment, will remain flat. The recovery should continue in 2012 with growth likely in 23 of 24 industries, including five industries that are predicted to grow at double-digit rates, led by housing starts at 61 percent, albeit from depressed levels, and communications equipment at 16 percent. Public works construction is the only industry anticipated to decline, by 2 percent, in 2012.

Filed Under: News Tagged With: recovery

Leading economic index increases for 24th staight month (1st time in 40 years)

April 25, 2011 by Charlie

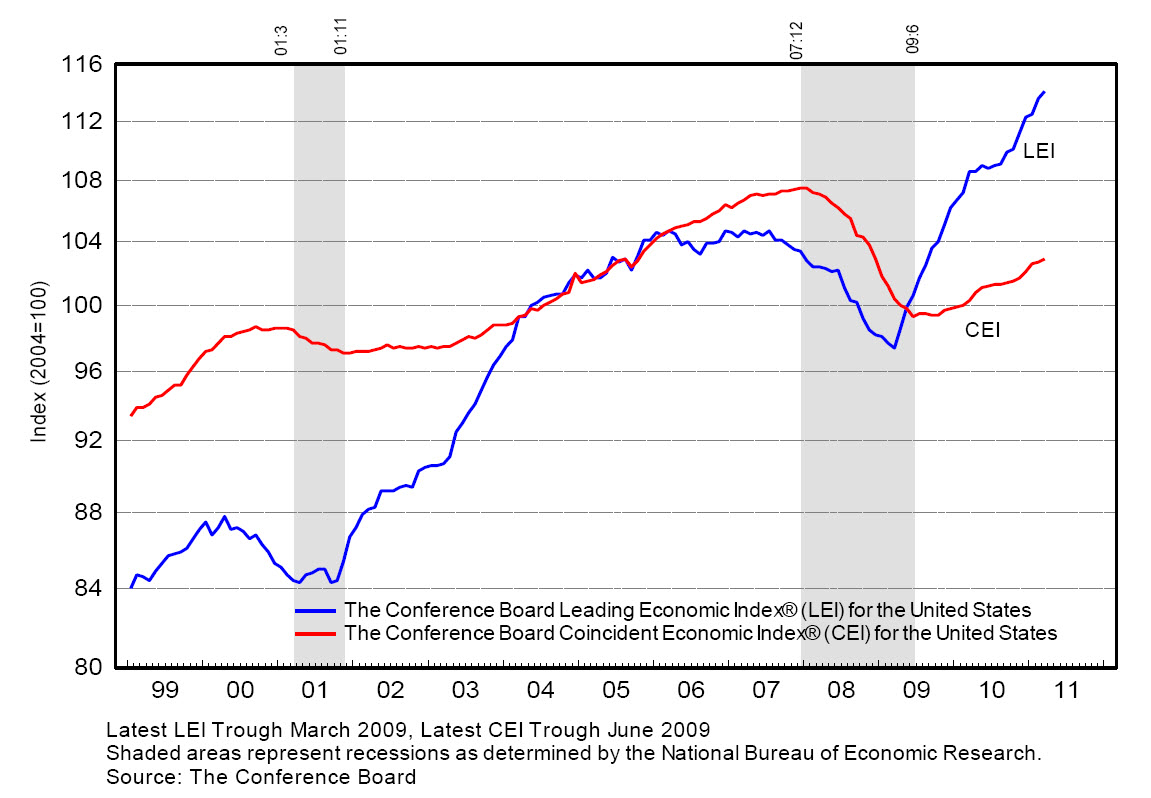
The Conference Board Leading Economic Index® (LEI) for the U.S. increased 0.4 percent in March to 114.1 (2004 = 100), following a 1.0 percent increase in February, and a 0.2 percent increase in January (see graph below).

Ataman Ozyildirim, economist at The Conference Board said: “The U.S. LEI continued to increase in March, pointing to strengthening business conditions in the near term. The March increase was led by the interest rate spread and housing permits components, while consumer expectations dropped. The U.S. CEI, a monthly measure of current economic conditions, also continued to rise, led by gains in industrial production and employment.”

Says Ken Goldstein, economist at The Conference Board: “The U.S. LEI continues to point to sustained economic growth through year end. Global disruptions, including unrest in the Middle East, rising oil prices and the Japan earthquake, may have some repercussions. However, it remains to be seen what the impact of these shocks will be on the United States and the broader global economy.”

Filed Under: Uncategorized Tagged With: recovery

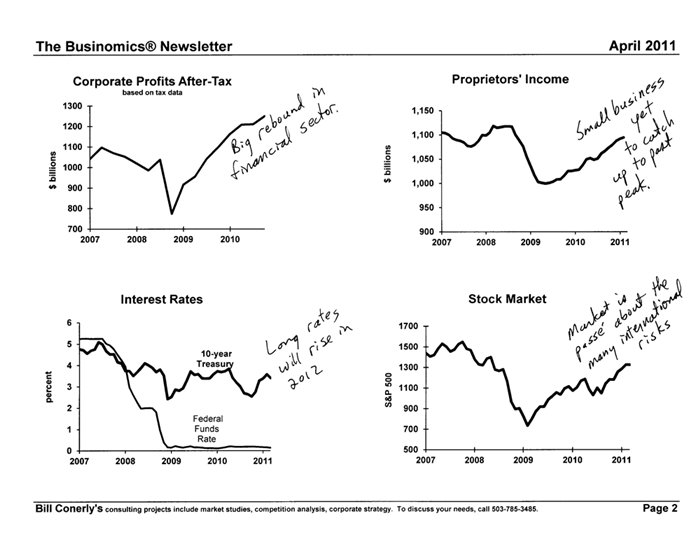
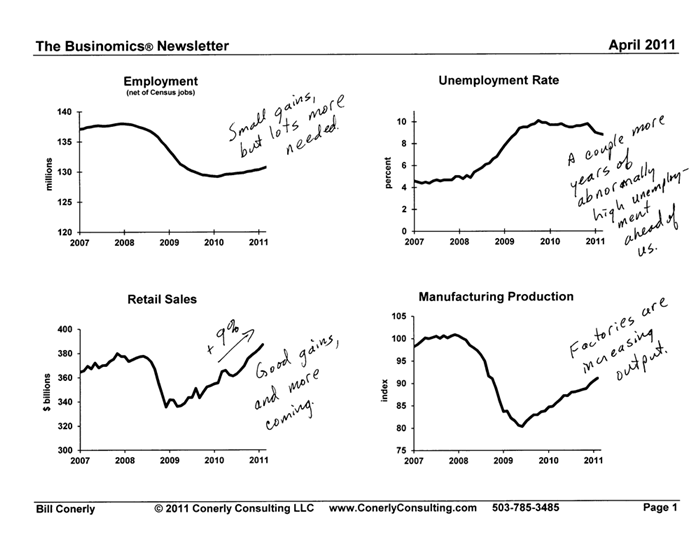
Improvement still slow in coming

April 13, 2011 by Charlie

The latest from Bill Conerly (www.conerlyconsulting.com)…

Filed Under: Uncategorized Tagged With: recovery

Doing More with Fewer

February 4, 2011 by Charlie

Excellent post by Mark Perry regarding the increases in worker productivity…


Perry reported last week that real GDP finally increased above its pre-recession level in the fourth quarter of 2010, and the $13.38 trillion of real GDP (2005 dollars) was the highest-ever quarterly output in U.S. history, slightly higher than the previous record of $13.36 trillion in the fourth quarter of 2007 (see top chart above).

But here’s what’s really amazing and is illustrated in the bottom chart: The U.S. produced slightly more output in Q4 2010 (by 0.14%) than in Q4 2007 when the recession started, but with 7.2 million fewer workers (almost 5%)!  Read more here at The Enterprise Blog.

Filed Under: Uncategorized Tagged With: recovery

The younger companies are, the more jobs they create, regardless of their size.

February 1, 2011 by Charlie

The popular perception that small businesses create most of America’s jobs has been the focus of heated debate for three decades. However, the more telling characteristic for predicting job creation is the age of the firm, not its size, according to a new study by John Haltiwanger, Ron Jarmin, and Javier Miranda. In Who Creates Jobs? Small vs. Large vs. Young (NBER Working Paper No. 16300), the researchers conclude that the younger companies are, the more jobs they create, regardless of their size.

Of course, all startup firms operate in a volatile “up or out” environment. After five years, many of these young companies are “out” — they fail and, as a result, destroy nearly half of the jobs created by all new companies. Nevertheless, the surviving firms continue to ramp “up,” growing faster than more mature companies, and creating a disproportionate share of jobs relative to their size.

“Firm startups account for only 3 percent of employment but almost 20 percent of gross job creation,” the authors write. “[T]he fastest growing continuing firms are young firms under the age of five,” the authors conclude.

In this study, which relies on data from the Census Bureau, the authors confirm that smaller companies created more jobs than larger companies during 1992-2005. But the importance of firm size depends very much on the assumptions one makes about the base year of the analysis, the number of employees used to define “small”, and other factors. The real driver of disproportionate job growth, they find, is not small companies, but young companies. It is the startup firms that generate the surge of jobs that earlier research attributed to small companies.

Indeed, grouped in traditional ways, businesses tend to create jobs in proportion to their importance in the economy. Thus, large mature firms — those more than ten years old and with more than 500 workers — employed about 45 percent of all private-sector workers and accounted for almost 40 percent of job creation and destruction in this study.

Filed Under: Uncategorized Tagged With: labor, recovery

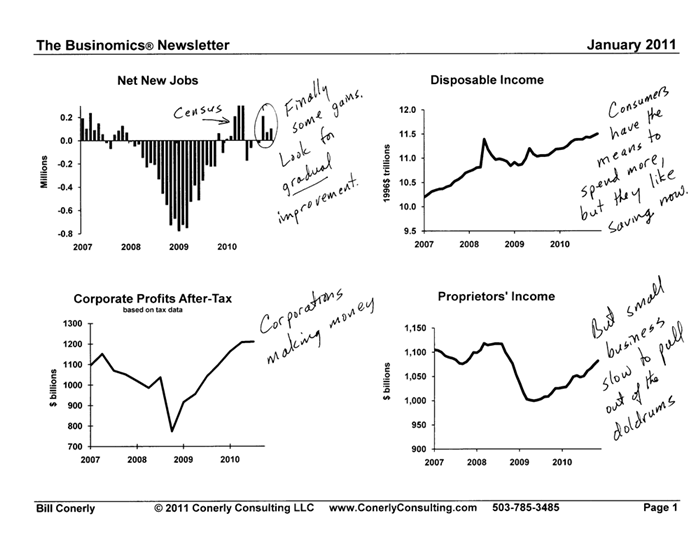
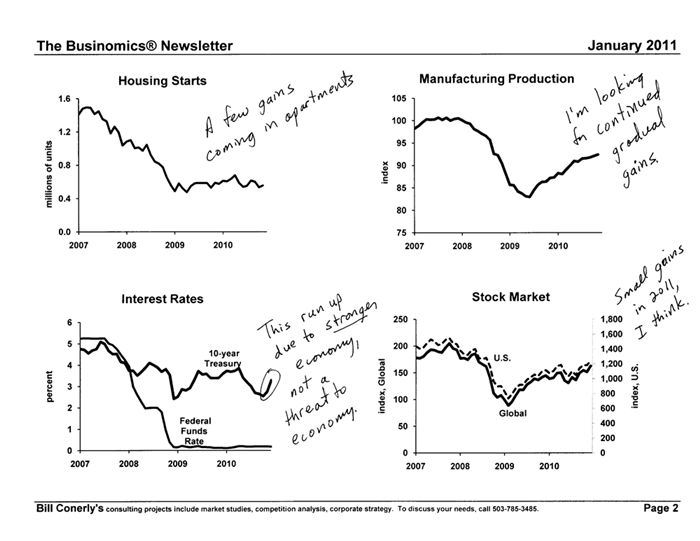
One small step…

January 14, 2011 by Charlie

The latest from Bill Conerly:

Source: Bill Conerly Consulting (http://businomics.typepad.com)

Filed Under: Uncategorized Tagged With: recovery

2010 Business Year in Review

December 29, 2010 by Charlie

Care to take a guess at the top events affecting businesses in 2010? The struggling economy was voted the top business story of the year by U.S. newspaper editors surveyed by The Associated Press. The rest, as they say, is history.

1. Economy struggles: Climbing out of the deepest recession since the 1930s, the economy grows at a healthy rate in the January-March quarter. Still, the gain comes mainly from companies refilling stockpiles they had let shrink during the recession. The economy can’t sustain the pace. The lingering effects of the recession slow growth. The benefits of an $814 billion government stimulus program fade. Consumers cut spending in favor of building savings and slashing debt. Businesses hesitate to hire. Cities and states lay off workers. Growth slows through spring and summer. Unemployment stays chronically high. In May, the number of people unemployed for at least six months hits 6.8 million — a record 46 percent of all the unemployed. Pointing to the deficits, Congress resists backing more spending to stimulate the economy. The Federal Reserve seeks to fill the void by announcing it will buy $600 billion in Treasury bonds to try to further lower interest rates, lift stocks and coax consumers to spend. As the year closes, the economy makes broad gains. Factories produce more. Consumers — the backbone of the economy — return to the malls. Congress passes $858 billion in tax cuts and aid to the long-term unemployed. Yet more than 15 million Americans are still unemployed. Economists say a full economic recovery remains years away.

2. Gulf oil spill: An explosion at a rig used by BP kills 11 workers and sends crude oil gushing into the Gulf of Mexico. The spill devastates the fishing and tourism industries along the Gulf Coast and causes environmental damage that may last for decades. BP sets up a $20 billion fund to compensate fishermen, restaurateurs and others whose livelihoods were damaged. The oil giant still faces civil charges and a criminal investigation by the Justice Department and lawsuits from hundreds of individuals and businesses. BP’s stock market value shrinks by more than $100 billion after the April 20 disaster before bouncing about halfway back.

3. China’s rise: China passes Japan as the world’s second-biggest economy. The World Bank says it could surpass the United States by 2020. China’s gross domestic product is spread out over 1.3 billion people — amounting to about $3,600 per person. That compares with GDP in the U.S. of about $42,000 per person. In Japan, it’s about $38,000 per person. China’s thirst for raw materials and other products helps the rest of the world recover from the recession. Still, the U.S. and Europe complain that China gives its exporters an unfair competitive edge by keeping its currency artificially low.

4. Real estate crisis: Housing remains depressed despite super-low mortgage rates. The average rate on a 30-year fixed mortgage dips to 4.17 percent in November, the lowest in decades. But home sales and prices sink further. Nearly one in four homeowners owe more on their mortgages than their homes are worth, making it all but impossible for them to sell their home and buy another. An estimated 1 million households lose their homes to foreclosure, even though the pace slows after evidence that lenders mishandled foreclosure documents. Some did so by hiring “robo-signers” to sign paperwork without checking their accuracy.

5. Toyota’s recall: Toyota’s reputation for making high-quality cars is tarnished after the Japanese automaker recalls 10 million vehicles for sudden acceleration and other problems. Toyota faces hundreds of lawsuits alleging that some models can speed up suddenly, causing crashes, injuries and deaths. Toyota blames driver error, faulty floor mats and sticky accelerator pedals for the unintended acceleration. The uproar damages its business. Toyota’s U.S. sales rise just 0.2 percent through November in a year when the industry’s overall sales climb more than 11 percent.

6. GM’s comeback: General Motors stock begins trading again. It signals the rebirth of a corporate icon that fell into bankruptcy and required a $50 billion bailout from taxpayers. GM uses some proceeds from its November initial public offering to repay a portion of its bailout. (Washington still holds about a third of GM’s stock.) GM’s recovery helps rejuvenate the industry. Sales of cars and light trucks rise 11 percent through November compared with the same period in 2009. Shoppers who had put off replacing their old cars return to showrooms.

7. Financial overhaul: Congress passes the biggest rewrite of financial rules since the 1930s. The law targets the risky banking practices and lax oversight that led to the 2008 financial crisis. The law creates an agency to protect consumers from predatory loans and other abuses, empowers regulators to shut down big firms that threaten the entire system and shines more light into markets that have eluded oversight. Republican critics say the law goes too far, imposing burdensome rules that will restrict lending to consumers and small businesses.

8. European bailouts: Greece and Ireland require emergency bailouts, raising fears that debt problems will spread and destabilize global markets. European governments and the International Monetary Fund agree to a $145 billion rescue of Greece in May and a $90 billion bailout of Ireland in November. The bailouts require both countries to slash spending, triggering protests by workers. Investors fear that debt troubles will spread to Spain, Portugal and other countries, weaken the European Union and threaten the future of the euro as its common currency.

9. Facebook growth: Facebook tops the 500 million user mark. It expands its dominance of social media and further transforms how the world communicates. If it were a country, Facebook would be the world’s third-largest. Facebook tightens its privacy settings after criticism that personal information is being disseminated without users’ knowledge or permission. Founder Mark Zuckerberg is named Time magazine’s “Person of the Year” and is the subject of a high-profile movie about Facebook’s creation.

10. iPad mania: Apple Inc. unveils the iPad, bringing “tablet” computing into the mainstream and eroding laptop sales. Apple is expected to sell more than 13 million iPads this year. The iPads sell about twice as fast as iPhones did after their 2007 introduction. The price of Apple stock rockets more than 50 percent in 2010. Competitors scramble to try to catch up. They include the Dell Streak, BlackBerry PlayBook, the Samsung Galaxy Tag and HP Slate.

Filed Under: Uncategorized Tagged With: financial markets, housing industry, international trade, recess, recovery, trends

Commercial real estate indicator is positive

December 22, 2010 by Charlie

Note:  This index is a leading indicator for new Commercial Real Estate (CRE) investment.

From the American Institute of Architects: Firm Billings Rebound in November

At 52.0, the AIA’s Architecture Billings Index (ABI) recorded a three point gain from the previous month, and reached its strongest level since December 2007. With ABI scores above the 50 level in two of the past three months, the prospects of a sustainable recovery in design activity are enhanced.

This graph shows the Architecture Billings Index since 1996. The index showed expansion in November (above 50) and this is the highest level since December 2007.

Note:  Nonresidential construction includes commercial and industrial facilities like hotels and office buildings, as well as schools, hospitals and other institutions.

According to the AIA, there is an “approximate nine to twelve month lag time between architecture billings and construction spending” on non-residential construction. So this indicator suggests the drag from CRE investment will end next summer. This fits with other recent stories about a pickup in design activity.

Filed Under: News Tagged With: housing industry, recovery

  • Page 1
  • Page 2
  • Page 3
  • Interim pages omitted …
  • Page 5
  • Go to Next Page »

About the Chair

  • About the Chairholder
  • Donors
  • Contacts

Advisory Commitee

  • Overview
  • Permanent Seats
  • Rotating Seats
  • Ex-Officio Members
  • Members Emeritus
  • Early History of the Ellison Chair

Multimedia

  • Webinars
  • Distinguished Lecture Series

Conferences/Workshops

  • Executive Academy for Growth & Leadership (EAGL)
View Charlie Hall's profile on LinkedIn
Texas A&M AgriLife Extension Service
Texas A&M University System Member
  • Compact with Texans
  • Privacy and Security
  • Accessibility Policy
  • State Link Policy
  • Statewide Search
  • Veterans Benefits
  • Military Families
  • Risk, Fraud & Misconduct Hotline
  • Texas Homeland Security
  • Texas Veteran's Portal
  • Equal Opportunity
  • Open Records/Public Information